Graphical user interface (pycraf-gui)#
Introduction#
The pycraf GUI is a little graphical application, which is shipped with
the Python pycraf package. It can be used to quickly analyze the path
propogation losses along a transmitter-receiver sight-line and plot the path
geometry. It is also possible to compute attenuation maps. At the moment, it
doesn’t come with an amazing amount of features, but it is foreseen to add
more in the future.
Using pycraf-gui#
To run the application, simply run:
pycraf-gui
Note
As for the pathprof sub-package, SRTM tile data is necessary
to query terrain height profiles. It is possible to have the GUI download
the tiles automatically. Nevertheless, if you already have SRTM (or other
.hgt) tiles, you can use them; see also Working with SRTM data.
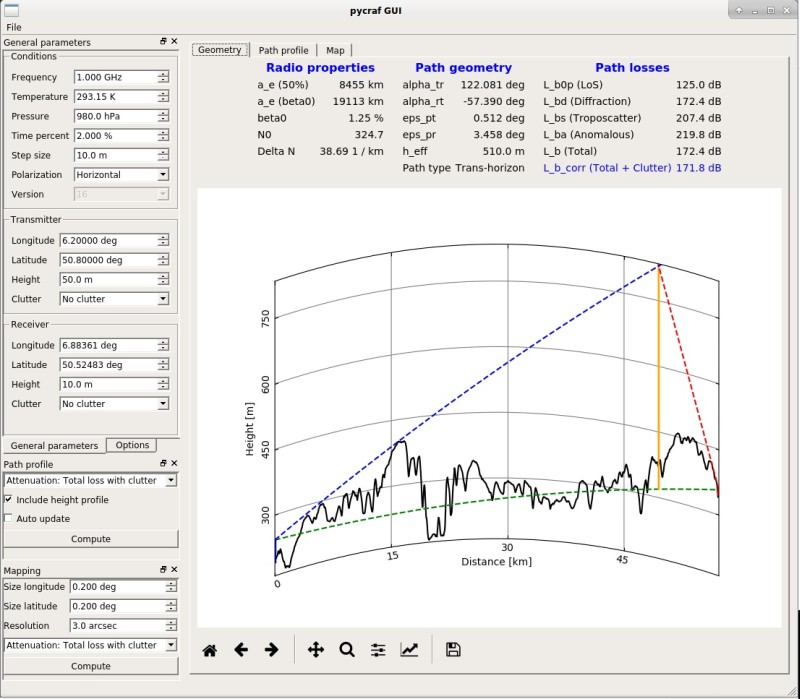
The GUI looks like the following:

In the “General parameters” pane, one can change the environmental properties, such as temperature and pressure, the desired radio frequency and of course the location of transmitter and receiver with their antenna heights, etc. Any change to these numbers will automatically update the “Geometry” display, i.e., the results of the path loss calculation and the associate path plot. It is also possible to compute plots of the path losses vs. distance (“Path profile” pane) and attenuation maps (“Mapping” pane).
Currently, it is possible to save the plots as images (pdf, png, etc.) but it is not yet possible to export the data into a disk file.
See Also#
Astropy Units and Quantities package, which is used extensively in pycraf.